Perhaps more than any other area of serious mathematics, fractals and more specifically the Mandelbrot set, have attracted a great deal of public interest. Continuing this pattern, the Mandelbulb set caused a great deal of excitement. As the Mandelbulb website it says, however, “there’s good reason to believe that it isn’t the real McCoy.” And so the question is left hanging, what is the real 3D Mandelbrot Set? In this essay, I will present the fractal that I believe deserves this position and why this is the case.
What is the Mandelbrot Set?
Before we can try and generalize the Mandelbrot set, we need to understand what it is. Answering this requires a substantial amount of mathematical context and I will move somewhat quickly through the basics. If you have trouble following, look up complex numbers or ask me in the comments.
Some Basic Complex Analysis
The real numbers (the numbers on the number line, 0, 2, -½, π…) are extremely useful things that we use in our day to day lives, but in a certain sense, they are missing something. In particular, not all polynomials have real roots, for example, x² = -1 has no real solution for x. If we introduce a number i such that i²=-1, however, it turns out that all polynomials have roots of the form a+bi where a and b are real numbers.
While it took mathematicians a surprising amount of time to realize it, the complex numbers have a simple geometric interpretation. Ask yourself, where is i relative to the real number line? It isn’t a positive number, since positive numbers times positive numbers are positive numbers and isn’t a negative number since negative numbers times negative numbers are postive numbers… and it certainly isn’t 0! So it isn’t on the number line. Then it must be beside the number line! Once one thinks about it this way, the complex plan interpretation is obvious:
The comparison between a+bi extends beyond the naturalness of this interpretation: they add in the same way! (a+bi) + (c+di) = (a+c) + (b+d)i, just as (a,b)+(c,d) = (a+c, b+d). Just like with vectors, you can think of complex numbers as arrows from the origin and their addition as putting one at the end of the other.
The multiplication of complex numbers is slightly more complicated. Allow me to introduce two new ideas: the magnitude of a complex number and the argument of a complex number. The magnitude of a complex number a+bi is the distance it is from 0, or while the argument is the angle it makes with the positive x-axis.
For example, both i and -1 have a magnitude of 1, but i has an argument of ½ π (90 degrees) while -1 has an argument of π (180 degrees).
Looking at a few examples of complex multiplication, one observes two things: the magnitudes multiply and the arguments add. For example, if we multiply 2i (magnitude 2, argument ½π (90 degrees)) by -1 (magnitude 1, argument π (180 degrees)) we get -2i (magnitude 2 = 2*1, argument π+½π).
(These anecdotal observations can be made rigorous. If you examine the action of multiplying a complex number as a linear transformation on another complex number interpreted as a vector, you will notice that it is a rotation dilation matrix scaling by its magnitude and rotating by its argument.)
Now considering x²: it is x times itself. So its magnitude is the magnitude of x times itself, and its argument is twice the original argument plus itself. Similarly, the magnitude of x³ is the magnitude of x cubed and the argument of x³ is three times the argument of x. In general, when you raise a complex number to the power of a real number n, it’s magnitude is raised to the power of n and its argument is multiplied.
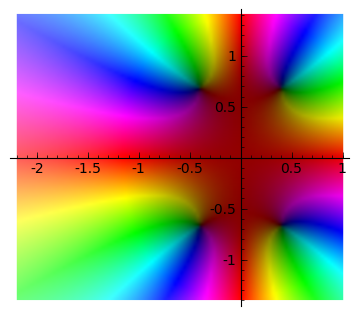
By mapping every complex number to a color, we can visualize squaring as:
 |
 |
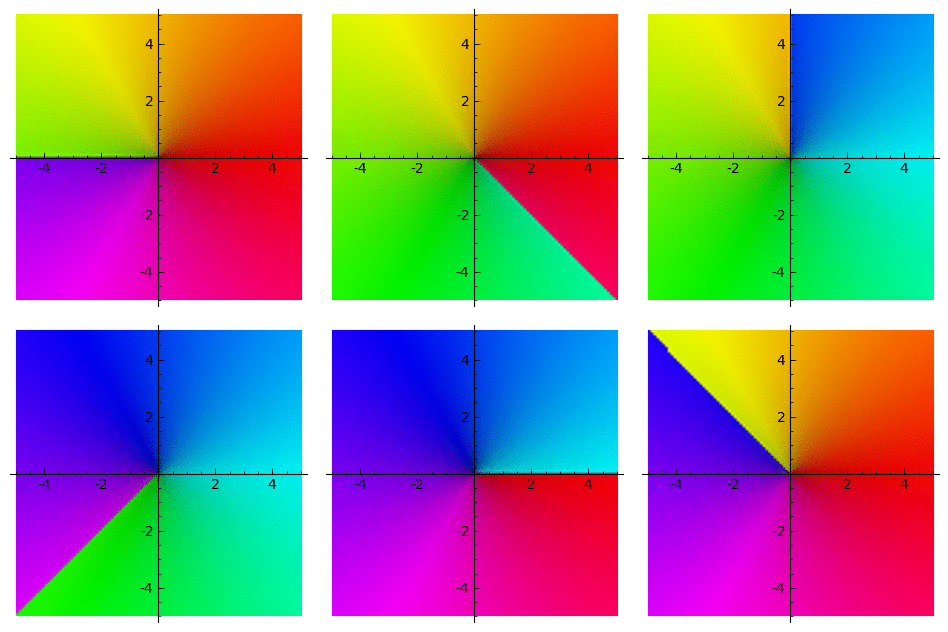
If we try to do it the other way, we get two valid answers:
 |
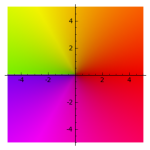  |
It is an example of a “multifunction” with two “branches.” The way these branches were cut was arbitrary:
We can also visualize these functions by the effects they have on sets:
 |
 |
Notice that the argument doubles and the magnitudes (inner was initially 0.5, outer 1.5) square.
 |
 |
As you can see, the set gets broken into two pieces when we go the other way!
Iteration: The Question Behind The Mandelbrot Set
Before we continue, allow me to introduce some notation. is an example of an anonymous function. It is simply a function that, given a value z returns z+1. So
. If you aren’t following, have a look at this post I wrote when I first learned about anonymous functions.
The other notation you need to understand is functional exponentiation. Basically, ,
… (There’s interesting questions about non-integer functional exponentiation, but that’s beyond the scope of this essay.) We can combine it with anonymous functions:
Now for the most important question in this essay: What happens if we apply a function infinitely?
The short answer is that, generally, extremely, extremely weird stuff.
Let’s try . So we’ll square, add 0.3, square again, add 0.3 again…
If we do nothing, we have the normal complex plane:
(equivalent to
)
(equivalent to
)
(equivalent to
)
(equivalent to
)
…
As you can see, things quickly get complicated.
Now, if you look back at how we’ve colored the complex plane, you’ll notice that light colors represent big numbers. And if you look at the fractals, you’ll notice that a lot of areas are becoming light. Finally, you’ll notice that once a number’s magnitude gets bigger than say, 2, it is guaranteed to keep becoming bigger, because the amount that the magnitude increases by will be 2 and even if it is negative and partly cancels with 0.3, the magnitude still increased significantly… So there’s a lot of points going off to infinity!
Well, which ones do and which ones don’t? We call the ones that don’t the Julia set, and they make pretty pictures:
The color represents the speed at which they go off to infinity.
What about the ones that don’t go off to infinity you ask? Well, I didn’t mention them because you can’t see them in this one. While there are points that don’t go off to infinity, they have no area, no measure — they’re just a bunch of disparate points, just like the cantor set. They’re along the lines where you see sharp change in color.
But since you asked, if they had been visible, they would have been black.
Now, there are other Julia sets. For example, we would have got a different Julia set if instead of iterating we had iterated
:
What, in the wide world, is going on?!?
Digging Deeper into Julia Sets
We should clarify what we’re talking about for a second, before we continue. A Julia Set of a function is the subset of the complex plane that doesn’t go off to infinity when we iterate
. We are usually consider with functions of the form
where
is a complex number — that is
— simply because they are the simplest case for us to study. When I refer to the Julia set of a number
I mean the Julia set of
. Even in this restricted case, however, there is still tremendous complexity: not only are they themselves infinitely detailed, but there is vast variety amongst these Julia sets, and even a slight change in the value of
can have a tremendous effect on the set.
(This definition is not universal. Sometimes the Julia Set refers only to the points on the boundary of the above set, especially in academic contexts. But this is the one I will use for the purposes of this essay.)
So the Julia Set of is
That is, the points on the complex plane that don’t go to infinity when we infinitely square and add to that number.
Earlier, when I pointed out that once the magnitude of point exceeds 2, it can’t be in the Julia set of 0.3, I didn’t just choose 2 as an arbitrary number that was sufficiently large to make that occur. I chose it because we’re generally interested, for reasons you will see shortly, in Julia Sets with the magnitude of less than 2. And if the magnitude of
is less than 2, the argument I made early still applies: once a number’s magnitude goes above 2, it must escape, since squaring it will increase its magnitude by more than 2 and even if
cancels against it completely, we are left with a bigger number.
This allows us to use a different definition:
(the same thing as above, except it stays under 2) or even
(the same as the first one, except it always stays under 2)
All these definitions are phrased in terms of the way we naturally think of Julia Sets — in terms of the question they come out of — but there are better ways to think of them when it comes to gaining insight into their properties.
Let be the Julia Set of
. Notice that we defined it as the part of the complex that maps to within in the circle of radius two when we iterate
. That is to say:
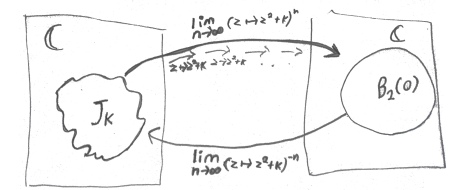
We can flip this around to get:
Let’s try finding a Julia Set with this new definition. Let We start with a circle of radius 2:
We want to do $latex z \mapsto z^2+k$ in the opposite direction, so first we subtract , shifting the set to the right:
Then we square root. This is where things start to get interesting. The important part to consider is the part on the right side of the vertical bar. It first contracts then splits into two pieces, one of which pivots a half turn on zero. (You may wish to consult the original pictures of square and square root.)
And we repeat. Subtract :
And square root. The right hand side behaves as before, but is thinner allowing the effects of the left hand side to come through. Since all those points have magnitudes less than one, they expand outwards, split into two pieces, which move to points a little ways up and down on the vertical axis respectively.
This time, lets do both steps at once: subtract and sqrt:
Again: subtract and sqrt:
Again: subtract and sqrt:
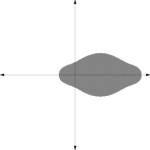
Keep doing this and you’ll get:
Now lets try again, with . Again, we start with a circle of radius 2.
We subtract , which moves it to the left:
Then we square root. Because it becomes taller and skinnier.
 We subtract
 again. Notice how zero is right on the boundary…
We square root. Since is the only stable point in square root, it is the only thing that bridges the two components our blob splits into.
Subtract … Notice that zero is not in the set anymore.
 We square root. Without zero, the two pieces resulting from square root split apart.
 The symetries of the problem now prevent zero from getting back into the set.
Lets subtract and square root…
If we keep going…
 While more “blobs” form, they shrink into points, just like in the Julia set of 0.3 I showed you earlier.
Obviously there is something fundamentally different between the Julia set of -1 and Julia set of 1. In fact, this difference divides Julia sets into two categories: connected and disconnected Julia sets. Disconnected Julia sets form when 0 escapes the Julia sets, since after that the “blobs” split in two each time, while shrinking into points (making them Cantor sets).
While it is easy to test if a Julia set is connected or not (is 0 in it?), we would like to know it there is an underlying pattern in what values of result in the Julia set associated with it,
, being connected.
Well, what values of leave it connected? The natural way to answer this is to consider the set of such points and what they look like:
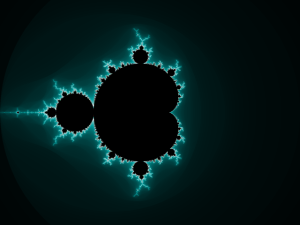
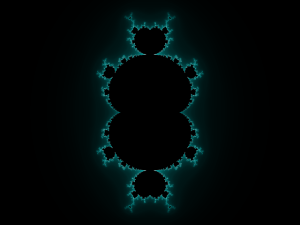
 We call this set the Mandelbrot set. It’s usually shown in color, with the colors representing how long it takes for zero to escape the Julia set associated with the point.
By inserting our original definition of Julia sets with our defition of the Mandelbrot set, we get:
Since :
Or, alternatively, the standard definition ( is the standard symbol, rather than
:
We call this set, striking both in its infinite variation and self-similarity, the Mandelbrot set, after the mathematician who first suggested we consider it.
We started with a simple curiosity as to what happens under iteration. That led us into a world of striking chaos. But the real surprise is that when we look at the big picture, we discover amazing patterns, geometric order underlying that chaos.
There’s a lot more that can be said about the Mandelbrot set. For example, if you consider the above definition, it is clear that the Mandelbrot set is locally similar to the Julia set associated with a give point, since varies little (an amazing demonstration of this is available here).
What is the Mandelbulb Set?
There exists a natural 4-dimensional version of the complex numbers called the quaternions, and by replacing the complex numbers with quaternions in the above definitions, one can get a type of 4D Mandelbrot or Julia set.
Unfortunately, there isn’t such a natural 3D version of the complex numbers. The Mandelbulb set is faced off a 3D construction that tries to have properties similar to normal complex numbers. On the Mandelbulb site, you can see that they experimented with a number of such systems and the results they produced, before eventually settling on one. They also increased the powers they were working with (ie. where we iterate
) in order to get interesting sets.
The results are stunning. Beautiful. Intriguing.
But the construction feels mathematically artificial.
Natural Extensions of the Mandelbrot Set
There’s another way to think of the Mandelbrot set. Consider the following diagram:
 Each axis represents a whole complex plane. The variables
 and
refer to the added constant and the initial value of our iteration (ie.
).
Julia sets are horizontal lines since we hold the added value constant and vary the initial value, where as the Mandelbrot set is a vertical line since we consider what happens when the initial value is zero and we vary the added constant.
The Mandelbrot is actually is also on the diagonal lines, since means we can step forward one iteration to
. And since $(-z)^2=z^2$ we also get the second diagonal.
 Now, if you only get to take a 2-dimensional slice (a single line in this picture) and want to summarize as much information as possible, the Mandelbrot set is probably your best choice. But what if you get 3 dimensions to work with? What is the best choice then? There are a number of compelling options.
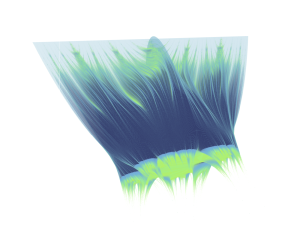
One tempting option is to show one particular group of Julia sets completely. For example, we could consider allowing to vary over the real numbers and the initial conditions to be any complex number — that is, all the real Julia Sets stacked on top of each other.
 |
   |
Spending time considering this fractal (and even 3D printing and physically touching it) has, personally, given me a much better understanding the behavior of the real-constant Julia sets.
We can also let vary over the complex number and the initial value vary over the real numbers.
This means that the Mandelbrot is fully embedded in the set.
There are, of course, two other slices. But before we look at them allow me to introduce a personal notation I use to differentiate between them. ZAKB is the fractal where initial values vary over A and the added constant over B. ZAXB is interchangeable with the above. For example, the previous fractal was ZRXC (R for the real numbers, C for the complex numbers).
All of these are interesting. Frankly, it almost brings me to the point of saying that 3 dimensions ins’t enough and add in the final dimension as time. We could call it the Mandelbrot-Julia set.
But 4 dimensions ought to be enough for anybody, right?
Well, as it turns out, not quite. A tiny bit of thought reveals a further two dimension that are tempting to play around with. Consider again the function:
What haven’t we screwed around with yet? Ah, yes, the two.
Functions of the form are usually mathematician’s preference for study because they’re so simple, but that hasn’t prevent the study of others. In fact, the version of the Mandelbrot set you get when you use other powers has been given a name, the Multibrot set.
It’s a little bit unfortunate that these fractals were called Multibrot sets, since it would have been nice to save for the fractal we get when we start stacking them!
We denote this Z0XCNR, since initial conditions are fixed at 0, the added constant varies over the complex plane and the power rages along the real numbers.
The moral of the story is that if you want to give the Mandelbrot set another dimension, options are not something you have a shortage of.
So which one is “the real 3D Mandelbrot Set”? ZCXR and ZCXI are right out, since they summarize something much more specific than the Mandelbrot set. Z0XCNR is much much broader in topic than the Mandelbrot set. And, between ZRXC and ZIXC, ZRXC feels more fundamental.
Pictures of ZRXC
Seahorse valley in ZRXC (there’s a bit of scaling going on):
Like the Mandelbrot set, ZRXC has sections that are very similar to the whole.
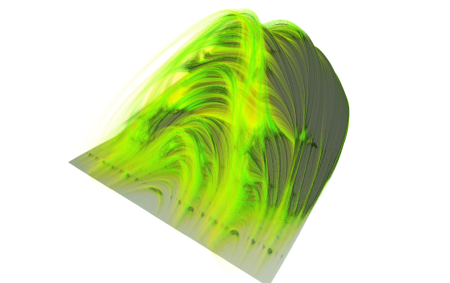
The following pictures were raytraced in a modified version of Mandelbulber. The results are quite nice, but may not be entirely accurate depictions — for example, some areas that are actually escaped, except for a few infinitely thin curves, appear to be solid.
Like the Mandelbrot Set, ZRXC has dendrites:
Seahorse valley from the inside:
Are These Fractals New?
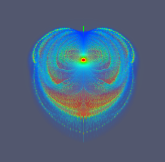
Well, at the very least, the idea of considering Julia sets and Mandelbrot set as orthogonal parts of a bigger fractal is not new — you can see it in programs like Gnofract4D and Paraview, both of which I used in making this essay. On the other hand, I’ve never actually seen them elsewhere, and I’ve never seen the power value thrown in as another dimension.
Most likely, this is simply a reflection of me being an unread ignoramus in the grand schemes of complex dynamics — it is far, far, too obvious to be novel. Hopefully, those more knowledgeable than me can inform me.
Even though I imagine these fractals aren’t new, they certainly aren’t well known. So I think this essay is valuable regardless.
Questions, Conjectures & Proofs regarding the Mandelbrot-Julia Set
I know little about this topic. Regard all proofs and claims with deep suspicion.
Just like there are interesting questions about the Mandelbrot set, there are interesting questions about the Mandelbrot-Julia Set.
Is the Mandelbrot-Julia Set Compact?
No. Unlike the Julia and Mandelbrot sets, it is not bounded, and thus not compact. I suspect it to be closed (the Julia sets and Mandelbrot set are), but I wouldn’t even know where to begin with a proof.
Is the Mandelbrot Julia Set connected?
It is trivial to prove that everything but a zero-measure part the Mandelbrot-Julia set is connected: All the connected Julia sets are connected to the Mandelbrot set (since they share the point z₀=0 with it) which is itself connected. Thus the connected Julia sets are all connected. And the others are of measure zero.
Before we continue, I need a lemma that I can’t prove but believe is known to be true.
Lemma: Any point in a disconnected Julia set reaches a fixed point or periodic cycle after a finite number of iterations. Why I believe this to be true: if they were slowly being dragged in over an infinite number of iterations, a neighborhood should be as well (ie. a basin of attraction). UPDATE: Gabe in the comments has informed me that this lemma is not true. This would seem to deal a fatal blow to everything from here down…
If this is true, we can get a very handy tool…
Lemma: A point in a disconnected Julia set can be described as a continuous function of the constant . Proof: If a point
ends up in a
-cycle after
iterations,
where
. Solutions to this can be considered as continuous function of
.
Then the Mandelbrot Julia set is connected. Proof: Let be an arbitrary point in the Julia-Mandelbrot set where
is a disconnected Julia set. Let
be the function associated with
from the previous lemma. Then
is continuous,
, and
. Then
is a path from
to a point in
. This means that all the points in disconnected Julia sets are also connected to the main Julia-Mandelbrot set, completing our proof of the connectedness of the Julia-Mandelbrot set.
Furthermore, it seems obvious (though beyond my ability to prove, so take this with a grain of salt again) that an arbitrary point in a connected Julia set can be path connected to one of the points from earlier (my understanding of basins of attraction is that an attracted point should be in a neighborhood of one of them). If this is the case, then the Julia-Mandelbrot set is path-connected.
If it is path-connected, the next natural question is to ask about its homotopy group. Connected Julia sets are known to be path connected and simply connected, and the Mandelbrot set is simply connected itself, which might lead one to suspect the whole structure to have a trivial homotopy group, but some of the pictures I’ve seen make me skeptical. A proof either way is utterly beyond me.
In any case, that’s where I wound up thinking about the Mandelbrot-Julia set, but I really don’t have the expertise for serious analysis. I could be completely out to lunch on just about everything in this section. It made for a fun topic to think about, regardless.
Conclusion
It is my hope that tis essay has convinced the reader, were they not already, that the Mandeblrot Set is more than a pretty picture: it is an answer to a question, or at least a step on the way. And when given another dimension to work with, the natural thing to do is to try to answer more…
Update
It’s been suggested that ZRXC is not the “Real 3D Mandelbrot Set” because it fails to achieve certain visual standards.
This is a legitimate concern. I understand that to most people, the visual aesthetics of a fractal are the most important part. One of the goals of this essay was to show the reader something else, more important and beautiful beneath that.
Different people will have different standards for judging whether something is the “Real 3D Mandelbrot Set” — to me the Mandelbrot set is a step on the way to understanding a mystery, to solving a puzzle. So my generalization tried to fulfill that role better.
You are welcome to disagree, and I think a very strong argument can be made that the Mandelbulb set is more visually appealing than ZRXC… But I’d ask you make sure you understand the math outlined in this essay — if you skipped the sections on what the Julia Set and Mandelbrot set are, you missed the point of this essay (if you had trouble following, that’s to be expected since I’m not always the best at explaining things, please feel free to ask below).
Perhaps I should have titled this “the Natural 3D Mandelbrot Set.” Hindsight is always 20/20.
Some Final Notes
If some of the content of this post seems familiar, it very well may be. Some of the complex analysis content was taken from post I wrote a while back (namely, this one and this one). It also substantially over laps with the Complex Analysis and Dynamics workshop I ran at hacklab a few months ago.
There are a number of people I need to thank. I’m grateful to everyone at hacklab who kept reminding me of the importance of pretty graphics in this post when I ran it by them. I’m particularly grateful to Geordie Bilkey who lent his awesome computer and graphics sense to getting me awesome pictures. I understand that he will be making even better ones, now that I’m not breathing over his shoulder 🙂
Secondly, I’m grateful to the people who have been experimenting with the mandelbulb. Their beauty of their work is inspirational — even if I don’t think it is the real thing 🙂
Finally, I’m grateful to Professor Yampolsky at UofT who answered a bunch of my questions when I was first learning about fractals back in high school: I very much doubt I would understand things as clearly as I do if he hadn’t. (More generally, I’m grateful to all the mathematicians who have taken the time to explain things, talk to me, and even just allow me to audit their classes over the last few years — it is remarkable how kind people have been.)
If you’re interested in 3D printing, you can get STLs here.
Follow me on Twitter, G+, or by subscribing to this blogs RSS feeds.
Tags: complex analysis, complex dynamics, fractals, mandelbrot set




















August 8, 2011 at 04:45 |
I started reading your posts originally for some OpenSCAD work, Christopher, but I’ve enjoyed the math even more. Your prose is very clear, each step well-motivated, without skipping steps in the reasoning. It’s a real pleasure!
August 8, 2011 at 04:56 |
Thanks, Evan!
August 8, 2011 at 16:52 |
“…since negative numbers times negative numbers are negative numbers…”
August 8, 2011 at 17:03 |
Agh! Thanks for catching that one!
August 8, 2011 at 22:10 |
“…since negative numbers times negative numbers are negative numbers…”
Here’s an example: -i * -i = -1 (negative i times negative i equals negative 1). Works for me 🙂
August 9, 2011 at 14:21 |
There is no concept of negative or positive when talking about complex numbers since the set isn’t ordered – you can’t say something is bigger or smaller than zero.
September 9, 2011 at 16:44 |
Both i and -i are also purely imaginary numbers (and complx, in the same way that all real numbers are complex). The set of all purely imaginary numbers is ordered, and it makes perfect sense to say negative i.
August 8, 2011 at 20:55 |
Great article. It looks like this latex snippet somehow didnt get compiled though:

August 8, 2011 at 22:13 |
Sadly, LaTeX in wordpress is prone to magical failures. 😦 I’ll mess around with the spacing in it or splitting it in two and hopefully it will go away.
August 8, 2011 at 21:24 |
Fantastic post… was wondering tho… the section describing z^2 in colors with two branches. Would it be more descriptive to show how the z^2 color map (sqr.png) has two possible solutions (and how they might differ from ident.png)? Then the choice of which “cuts” to make in the branches more clearly(??) show how you still have a full palette in each branch of z.
Also, the arc examples took a minute to work through… but I think the color examples were more compelling.
That said, the issue might be mine alone! 🙂
August 8, 2011 at 22:20 |
You mean put boxes around the parts in sqr that result in two branches (or similar)? That’s not a bad idea at all…
>Also, the arc examples took a minute to work through… but I think the color examples were more compelling.
I’d agree that they’re a bit harder to follow… But they lead into the Julia sets better. I need to get people thinking about what sqrt does to sets. 🙂
August 9, 2011 at 01:34 |
I enjoyed reading your post. The pictures are absolutely striking. However, the first lemma you conjecture is incorrect. It is possible for a point in a disconnected Julia state to have an aperiodic orbit. If one uses symbolic dynamics to analyze the orbit of the function $z^2-4$ for instance, whose Julia set is a Cantor set on the real line, you can find aperiodic points points. You can even find points whose orbit is dense in the Cantor set! I am not completely sure of this, but I believe that all of the disconnected Julia sets and all of boundaries of the connected Julia sets have this property. This follows since iterating the function on points on the J-set displays chaotic behavior. I believe this implies a dense orbit by the Baire theorem and top. transitivity. Cheers.
August 9, 2011 at 03:54 |
Thanks you so much for taking the time to correct that. I’ve had a very long day and my brain isn’t functioning well enough for me to really understand your comment, so I’ll give a more intelligent response tomorrow 🙂
August 9, 2011 at 13:07 |
I enjoyed this post a lot, especially your geometric explanation of Julia sets.
August 9, 2011 at 13:54 |
Glad to hear it!
August 9, 2011 at 15:07 |
[…] is inspired by this chris post. Incredible! I’ve always wondered how julia sets link to mandelbrot set visually, and here is […]
August 15, 2011 at 12:39 |
Wow!
November 22, 2011 at 06:13 |
I’ve just stumbled upon your blog while researching for a paper that I’m writing. You are genuinely amazing. This is beautiful, brilliant.
December 24, 2011 at 01:25 |
[…] the pictures gave me time to reflect on the variety one can find within the Mandelbrot set. While well aware of the mathematical elegance of the Mandelbrot Set, I’d started to forget about what one could find deep inside it… Yay, […]
February 20, 2012 at 21:28 |
It seems that Phi should be your Lemma in the Julia. 4/Pi. That would also hint at another observable set in the 8th. Phi is the attractor responsible for chaos in 2.
January 31, 2013 at 10:41 |
As a graphic designer, and someone who is sort of obsessed with not only informational display, but also developed an early fascination with the Mandelbrot Set a an undergrad Computer Science major in the early 1980s (when it was all new and revolutionary), I’ve been thinking about this for a long time.
Plotting the points that trend away from Z, using their rate of escape as a 3-D coordinate is something I’ve wanted to see for a long time, and I’ve always wondered why nobody was doing it. It seems to me, as a designer, that such a display methodology is more “truthful” and represents the reality of he data in a more meaningful manner.
Sure, the 2-D Mandelbrot plots we all know and love are beautiful, but the arbitrary color keys they use are essentially useless as a mode of communicating the meaning of the data. People can relate to 3-D renderings because we live in world of texture, depth and movement. You seem to be making real the thing I’ve dreamed about all these years, but my mathematical skills (or lack thereof) kept me from manifesting myself.
Keep at it–you re on to something here–something that can fundamentally change the way we understand this phenomenon. This approach to plotting the Mandelbrot set has the potential to really reveal the aspect of this data that I feel is the most important–that the REALLY interesting data is the “outliers”–the points that re outside the Set.
Understanding that the points that trend AWAY from Z are what makes it “juicy” is an exciting, evolutionary, and delightfully dangerous “truth”, and plotting the Mandelbrot Set to finally reveal this potentially has some SERIOUS cultural, social, political and even metaphysical ramifications, that I for one, would LOVE to be part of bring into being.
Keep up the work, and please keep us posted on your progress…
March 17, 2014 at 20:38 |
Surfing the Internet I have reached here and read:
“Plotting the points that trend away from Z, using their rate of escape as a 3-D coordinate is something I’ve wanted to see for a long time, and I’ve always wondered why nobody was doing it.”
A couple of months ago I thought about this question and did it. I added the third dimension to the Mandelbrot Set (to its border, actually) based on two principles:
– The original Mandelbrot Set is a 2D photo of the “extended 3D set”.
– The more the iterations needed to know that diverge, the more the distance to a point from the observer. The Mandelbrot Set points are at infinite distance.
I developed an algorithm to calculate what each eye would see and created some 3D images: http://www.flickr.com/photos/in4ur. You have to download the images in original resolution (1920×1080) and view on a 3D TV in Side By Side mode. I’m also making a 3D video that will be finished in two weeks or so.
Mathematically, perhaps, there is nothing new, but visually… It’s worth a (3D) look.
March 18, 2014 at 02:37 |
If you don’t have a 3D TV, the “Magic Eye” autostereogram method works for me. Using the “wall-eyed” technique (relaxing focus and letting my eyes stare into the distance beyond the screen), I see the 3D image. You’ll have to get your computer to scale the Mandelbrot image to a size in which the separation of the two halves of the image is somewhat less than the distance between your eyes.
March 18, 2014 at 18:23 |
That method may work as a replacement, but you see deformed (narrowed) images and I guess you lose a lot of detail.
Viewing the images on a big 3D TV, in all their glory, is priceless 😉
March 20, 2014 at 03:45 |
I’ll try it when you give me the money to buy the necessary equipment. In the mean time, my solution is much better.
January 31, 2013 at 22:55 |
Richard, your post reminded me about this incredible article, and that I posted a vague comment about a year ago. Since then I’ve been researching and exploring on my own.
I’ve found the portion of the Mandelbrot set near the singularity (-2 in the imaginary plane) shows a natural tie between several mathematical forces. Near this point, the rendering of the set at 10e-32 shows influences of Pi, Phi, and e as they relate to squares.
To really appreciate this relationship, it’s best to view it in a rendering. Take a look at the video of this section at http://youtu.be/aqz7eSbBMy4 .
The edge detection algorithms used to render the video show the natural 3D form of the Mandelbrot near the singularity. Understanding this system could be helpful in working toward a mathematical manifold which could be used for space-time calculations. Otherwise, maybe it’s just good for pretty pictures. Time will tell.
July 27, 2013 at 05:52 |
Wow, Jeremy Sylvester, that video looks very close to what I imagine a 3d mandelbrot should look like! Perhaps you’ve finally found it! I can’t imagine a proper 3d mandelbrot having all the pulled taffy. It should branch like a tree or a plant.